As part of the Covenant of International Cooperation between the Municipality of Bucaramanga, the Metropolitan Area of Bucaramanga (AMB), UN-Habitat, and Despacio, a tactical urbanism intervention was realized in the ‘Parque de los Niños’ park in Bucaramanga on the 14th and 15th of August, 2018. This project aimed to redistribute the available road space in order to improve the road safety of the area, recover the public space’s value, reduce the traffic speeds of motorized vehicles, and create a safe and inclusive pedestrian crossing.
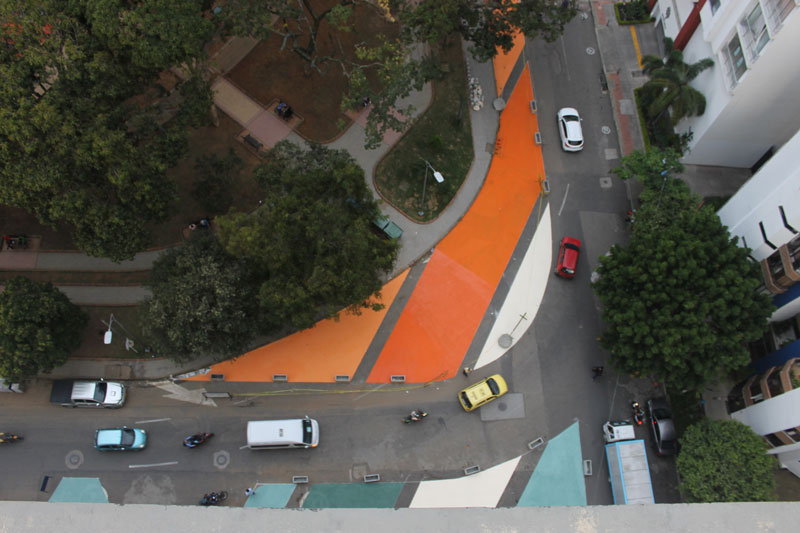
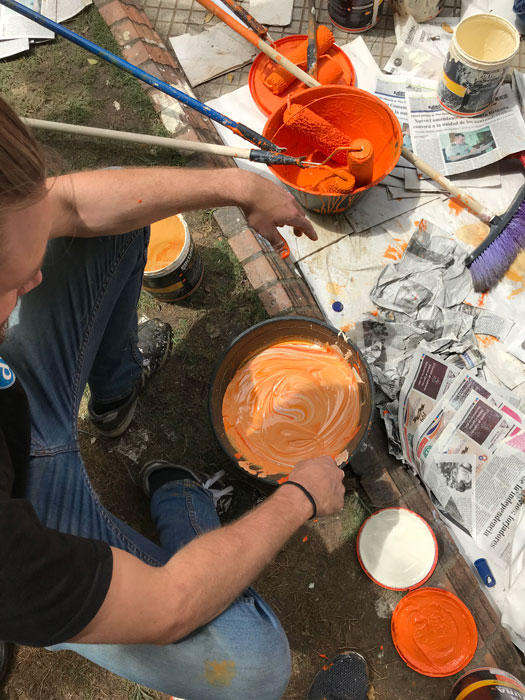
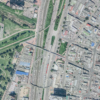
Image 1. The final stage of the intervention from above
The tactical urbanism intervention took place in the southwestern corner of the park at the intersection of the 26th Avenue (Carrera 26) and 32nd Street (Calle 32), a point identified as critical in terms of road safety risk for pedestrians and cyclists. Additionally, various residents of the area had previously expressed interest in the implementation of improvements to pedestrian transit and actions against invasive parking to the municipality.
With the aim of defining a suitable design and to establish a baseline against which to evaluate the impact of the intervention, on the 9th of August 2018 studies were carried out of: traffic volumes, vehicle speeds, pedestrian desire lines, and wait times before pedestrian crossings. This field work was done with the support of the Transit Agency of Bucaramanga (Dirección de Tránsito de Bucaramanga), and the Bicycle Office (Oficina de la Bicicleta). Based on the findings and taking into account the previously mentioned objectives of the tactical urbanism, the following interventions to reorganize road space were proposed:
- Extension of pedestrian space without reducing the amount of traffic lanes.
- Shortening of pedestrian crossing distance from up to 20 metres to 7 metres.
- Implementation of a signaled pedestrian crossing at the same point, permitting safe crossing of pedestrians to and from the Parque de los Niños
- Reduction of the turn radius of vehicles moving from the Carrera 26 to the Calle 32, leading to the reduction of traffic speeds and increased visibility for vulnerable users crossing this point.
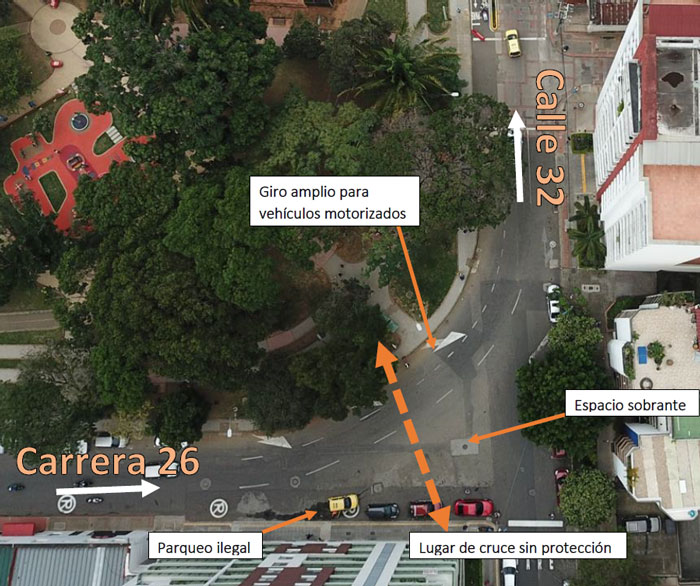
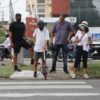
Image 2. Situation before the intervention with principal problems indicated
The implementation of the intervention took two days, during which we relied upon the help of the EMAB (Waste Disposal Agency), the Traffic Agency, the INDERBU (Youth, Sports and Recreation Agency), and volunteers called up by means of social media.
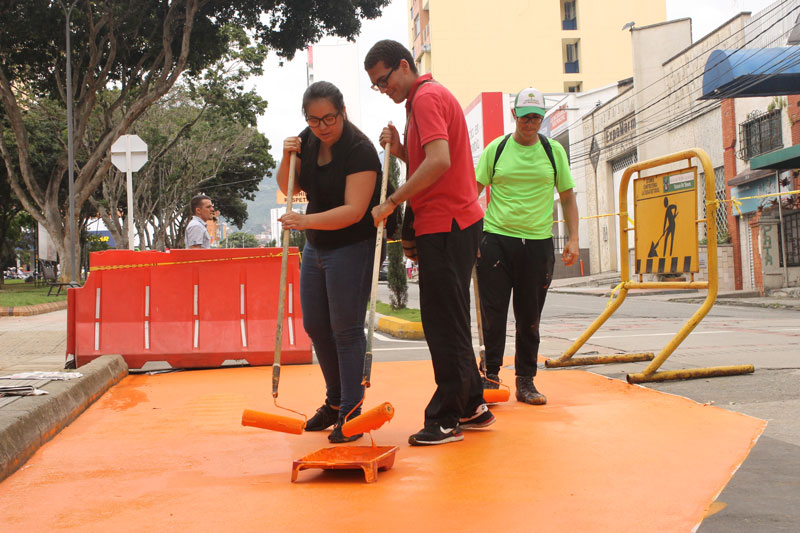
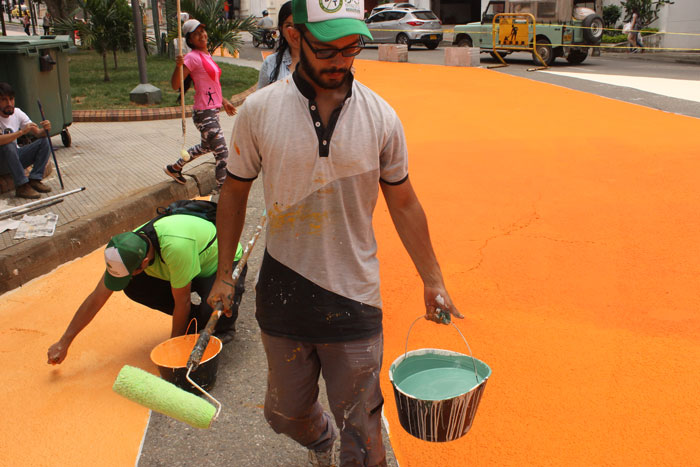
Image 3: Volunteers painting the street
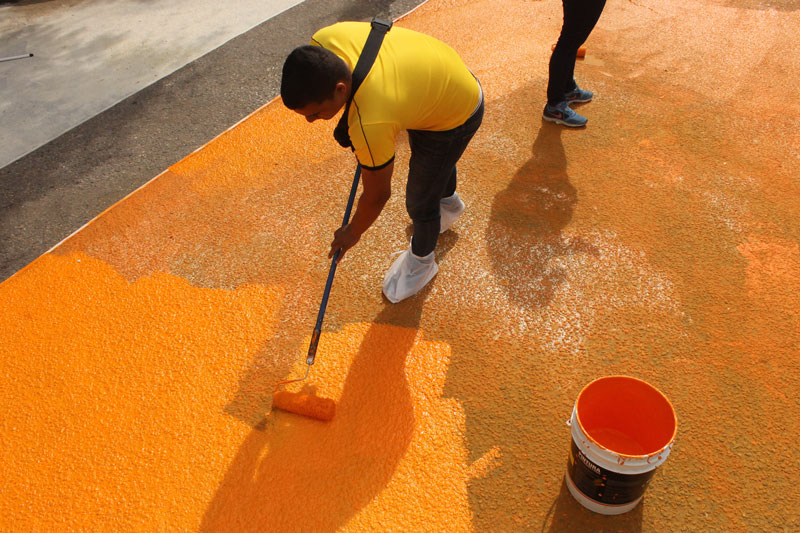
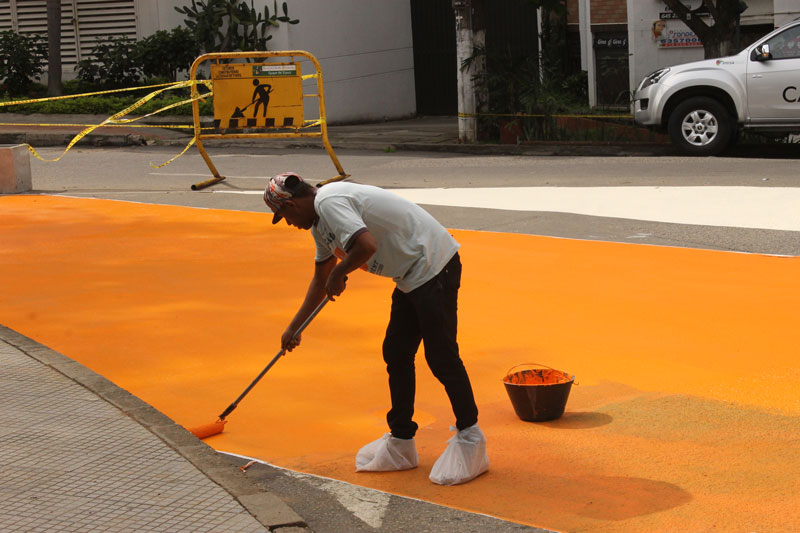
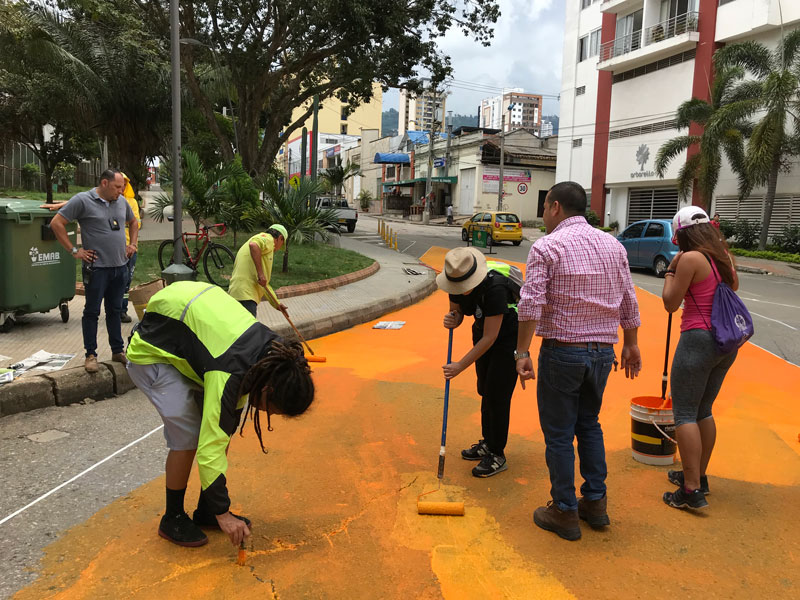
Image 4: Volunteers painting the street
The intervention’s impacts
The traffic study compared the situation before and after the intervention with regards to traffic speeds of motorized vehicles, pedestrian behavior, and the perception of pedestrians passing through the area.
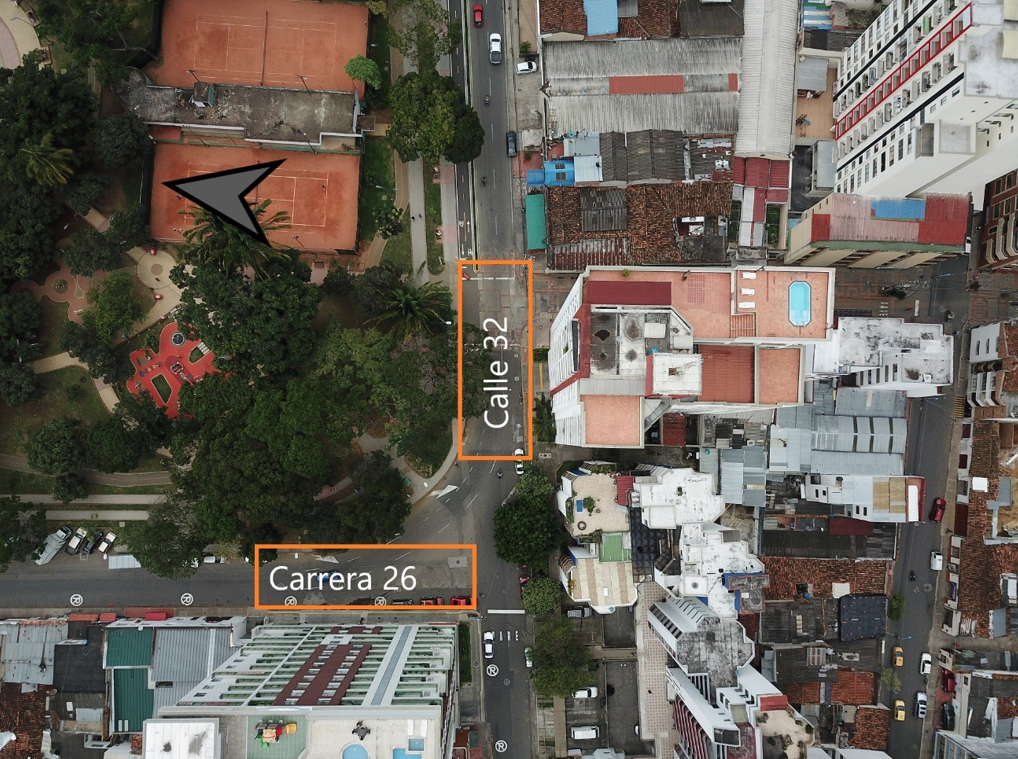
Image 5: Measurement points in the traffic study.
Pedestrian perception survey
In this section, the results of the surveys are presented, comparing the responses before and after the tactical urbanism intervention.
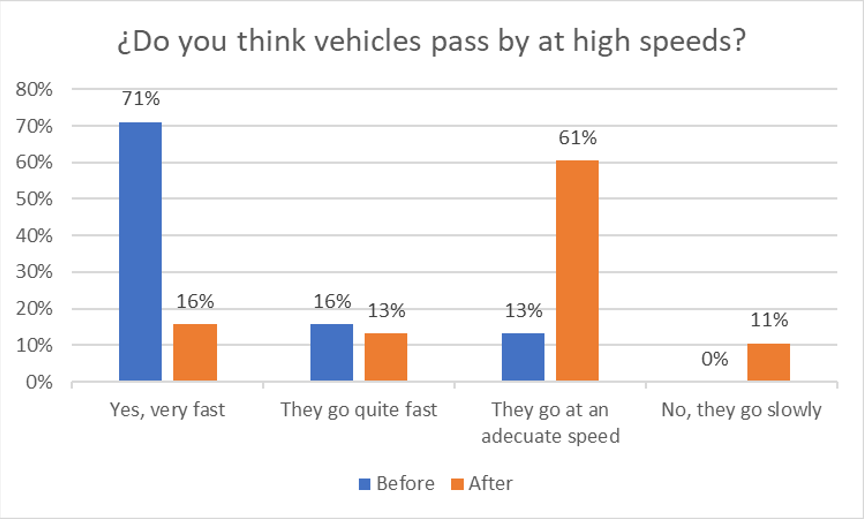
Image 6: Perception of traffic speeds in the area of the intervention, before and after
Image 6 show the perception of traffic speeds by pedestrians in the area of the intervention, both before and after the implemented changes. Before the intervention, 87% of those surveyed indicated that traffic speeds were high, with a mere 13% saying that speeds were adequate, and no respondents perceiving slow speeds. This emphasized the necessity of lowering traffic speeds through the intervention’s design. The perception after the intervention is clearly different, with the majority of pedestrians (72%) responding that traffic speeds were adequate of even low, with less than a third (29%) perceiving high traffic speeds.
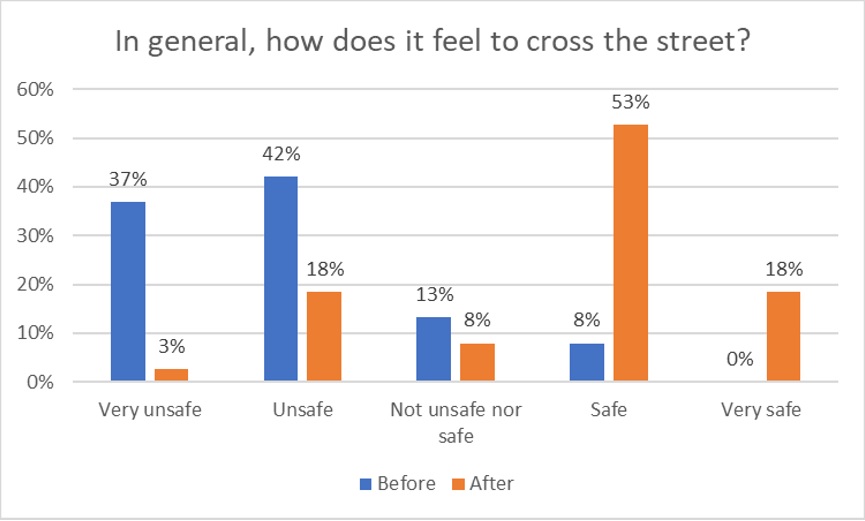
Image 7: Perception of security during pedestrian crossing, before and after
An important objective of the intervention was to improve the road safety and comfort of pedestrians. Image 7 shows the perception of road safety during pedestrian crossings in the area of the intervention. With 79% of respondents indicating perceived insecurity before the intervention, the situation was clearly highly risky and uncomfortable to pass through. After implementing the changes, the lower traffic speeds, signaled crossing, and shorter distance to cross, led to a much changed pedestrian perception. 71% of those surveyed felt ‘safe’ or ‘very safe’ making a pedestrian crossing. Illustratively, the percentage of responses indicating feeling ‘very unsafe’ was reduced from 37% to just 3%, while the amount of pedestrians feeling ‘very safe’ rose from none to 18%.
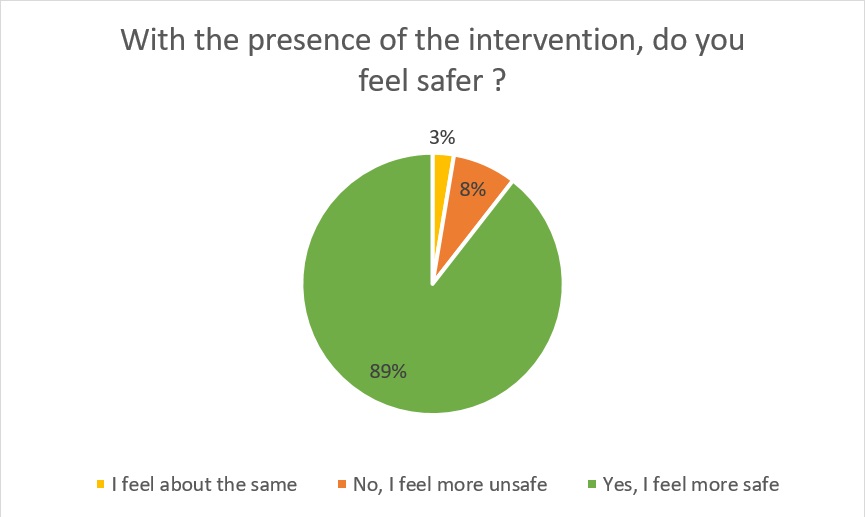
Image 8: Changes in the perception of safety.
Concurrently with the improvements in the perception of road safety in pedestrian crossings (image 2), during the survey realized after the intervention, 89% of respondents affirmed feeling safer due to the presence of the tactical urbanism intervention. This confirms that pedestrians perceived the intervention to have led to an improvement in their road safety.
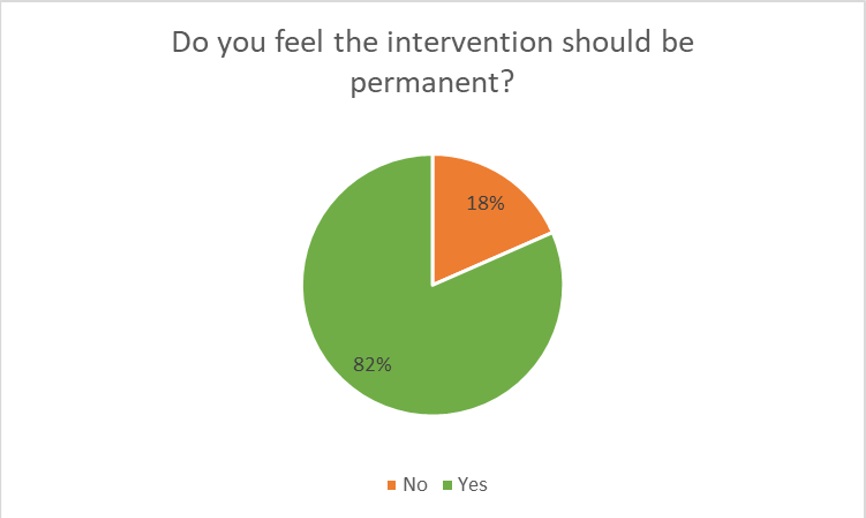
Image 9: Desirability of permanence of the intervention
Shown in image 9 are the responses to the question whether the intervention should be made permanent. Of all the passers-by consulted after the intervention had been implemented, 82% responded that they felt the intervention should be made permanent.
Traffic speeds
Motor vehicle speeds are a principal factor in the risk of vehicle crashes, with increased speeds leading to higher risk of crash, and higher risk of death or injury in that eventuality. Additionally, high speeds make pedestrian crossing more difficult and create a hostile environment for vulnerable road users. Therefore, the reduction of excessive traffic speeds should be a central objective of any intervention looking to improve road safety and pedestrian comfort.
There are different ways of interpreting traffic speed data. Although average traffic speed is an intuitive and easily understood indicator, it is not necessarily the most important, and it could be argued that it is desirable to maintain average speeds in an intervention (if the average speed is not excessive) as it would show that traffic flow is not adversely affected. On the other hand, the 85th percentile specifies the velocity of the fastest vehicles, which pose the highest risk to vulnerable users, and the reduction of the most excessive speeds should not affect traffic flow. Finally, the percentage of vehicles exceeding the speed limit (in this case, 30 km/h on both roads) is an indicator of whether the road layout corresponds to its legal status as a local road.
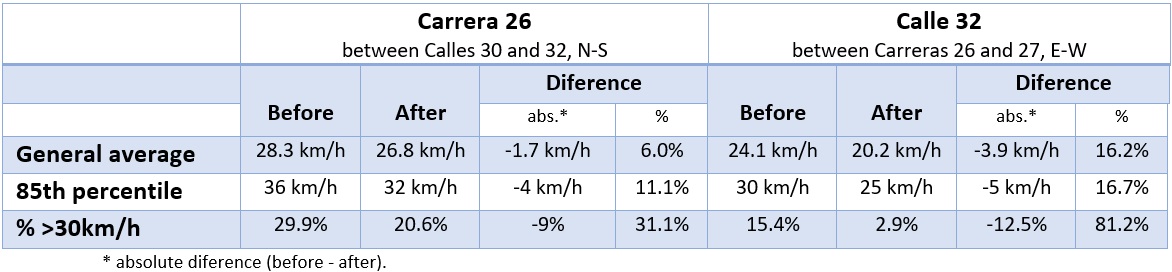
Table 1: Traffic speeds registered in Carrera 26 and Calle 32, before and after
The results shown in Table 1 indicate that the intervention has led to lower traffic speeds, with significant reductions across all indicators at both measurement points. Both points show that the reduction of the 85th percentile and the percentage of vehicles exceeding the speed limit was higher than the reduction of average speeds. This means that excessive speeds have been reduced without significantly affecting traffic flow and travel times.
Pedestrian behavior
To measure changes in pedestrian behavior, two types of evaluation were carried out: the amount of pedestrian crossings made over the new signaled crossing (after the intervention), and the amount of waiting time before pedestrian crossings (comparing before and after).
As part of the design of the intervention, a pedestrian crossing with horizontal signaling was implemented across the Carrera 26, between the residential western side of the street and the Parque de los Niños park on the eastern side. This point had been previously identified as an important desire line for pedestrian crossings. After the intervention, on the 23rd of August a measurement was made to determine the movements of pedestrians in the area.
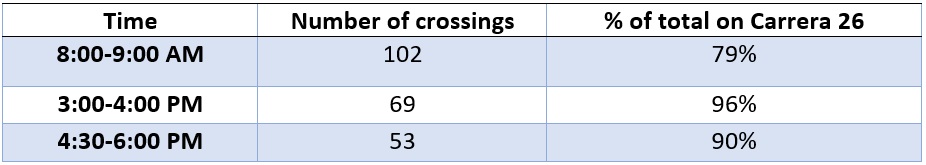
Table 2: Pedestrian crossings over new signaled crossing
The data in Table 2 show that the pedestrian crossing has attracted many pedestrians, channeling their movements through the signaled crossing, which improves their safety as the crossing has become predictable and clear to vehicles. It must be underlined that before the intervention, pedestrians crossed at various points and from different angles, leading to a much higher risk of crash and lower confidence by vulnerable pedestrians.
A more precise way to quantify the road safety, comfort, and the road’s level of service for pedestrians is through an analysis of wait times for pedestrian crossings. Higher waiting times before crossing indicate that pedestrians cannot find a safe and comfortable moment to cross, while lower times indicate that pedestrians feel more comfortable and at lower risk.
Registers of wait times were realized both before and after the intervention, in the Carrera 26 (crossing East-West and West-East), and in the Calle 32 (crossing North-South and South-North). The measurements were carried out on the 9th and 23rd of August, between 7:30 and 9:00 AM and 4:30 and 6:00 PM, peak times for both pedestrian and vehicle traffic.
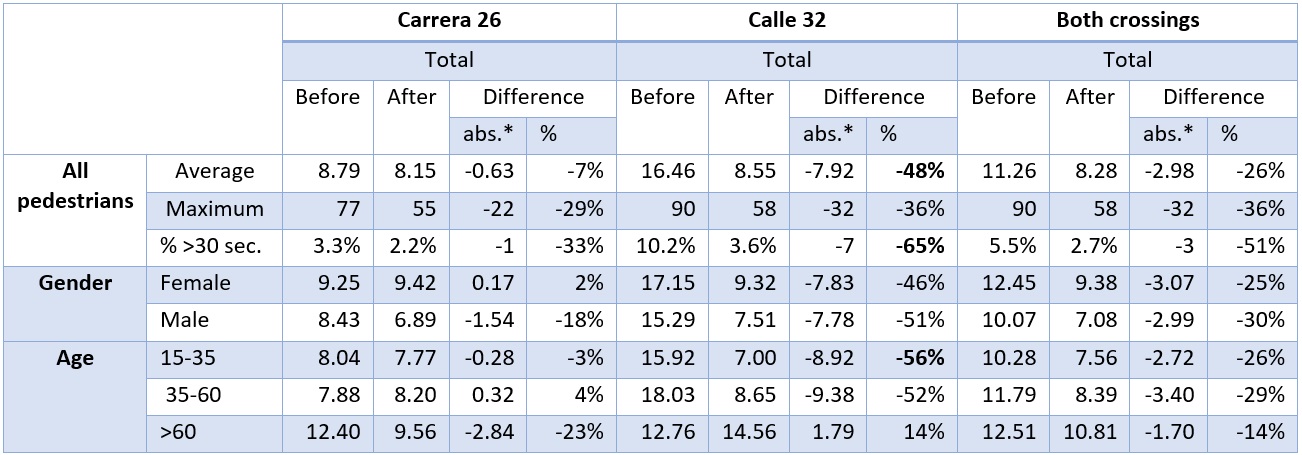
Table 3: Wait times for pedestrian crossings, in seconds
The results of the analysis are shown in Table 3. Wait times are seen to be significantly reduced on both streets, with a global 26% decrease in wait times, representing nearly 3 seconds of reduced wait time for the average crossing. The level of service in terms of reasonable wait times has improved substantially, with a significant reduction in the maximum wait time (from 90 seconds to 58), and the amount of pedestrians waiting over half a minute has been reduced by half (-51%).
On the Calle 32, wait times were high with over 16 seconds on average, and the reduction has been most pronounced with times nearly halved (-48%). Similarly, this point showed the largest reductions in terms of maximum wait times and the amount of people waiting over 30 seconds, which used to be over 10% and has been reduced to under 4%. In the Carrera 26, the average wait times were not high to begin with, and the reductions were less pronounced, though not insignificant.
Conclusions
The result of the efforts to realize the intervention has been resounding. With simple and quick changes to the road space it was possible to beautify a previously neglected area. More importantly, the measurements indicate that the intervention’s impact has been as hoped – it is perceived positively by passers-by, there are clear improvements to road safety and pedestrian mobility, and traffic flow has not been affected negatively.


Comentarios recientes